
PR Analytics: A Brief Breakdown
You’ve finally submitted your first press release. you’ve learned all about the benefits of having a professional writing service look over your release, and you’ve made sure that the piece is optimized for search to maximize your story’s potential.
A few days after your release is distributed, you are presented with your campaign stats. They might look a little something like this:
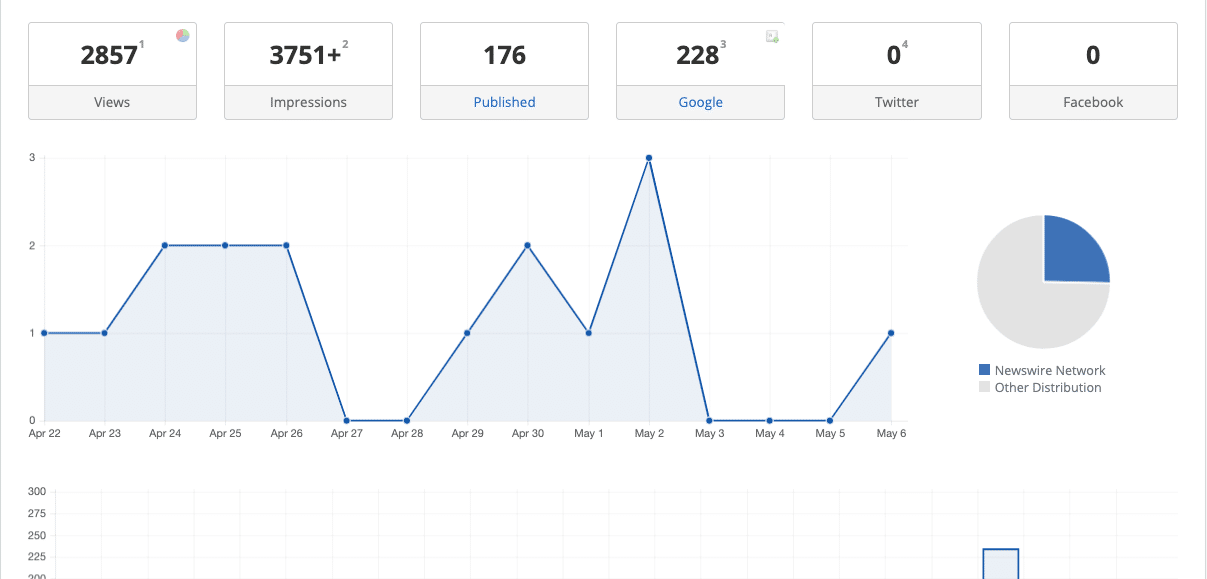
Seems a bit confusing, right? What’s the difference between views and impressions? What does that “published” metric represent? And what is going on with that graph at the bottom?
If you find yourself asking these questions, there is no reason to worry. Today, we will explain the different metrics found in a typical PR campaign report by breaking down an the results of an actual Newswire client.
Views vs. Impressions
On the surface, views and impressions seem extremely similar, to the point where they could easily be misconstrued to be the same metric. This is not the case. A view is a definitive instance in which a piece of content is seen or read by a user. An impression, however is an instance in which a piece of content is either viewed OR has the potential to be viewed. Typically, both instances are tracked internally by the distribution service. Because impressions include potential views, impression counts are usually higher than strictly view counts.
Know Your Categories!
In addition to the views and impressions, there are also tabs titled “published” and “Google” that appear next to the social media tracking tabs labeled “Twitter” and “Facebook.”
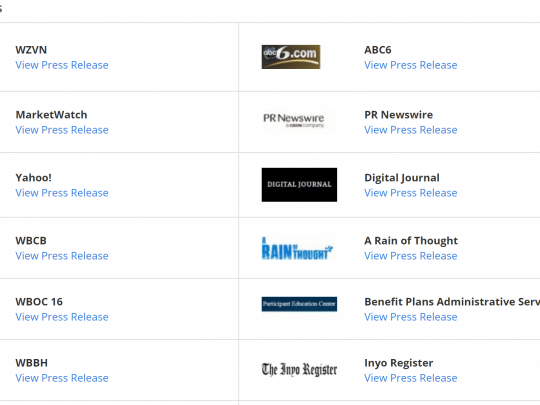
The published tab indicates how many distribution sites posted your content on their site. In our module, clicking this tab brings you to a list that displays the name and logo of all of these sites.
Clicking the Google tab will bring up a Google search page in which all of the sites that have published the release can be viewed. There are certain instances in which Google will detect keywords or phrases that are similar to those included in the headline of a release. This is why the “Google” metric may appear higher than the total “published” metric.
The social media tabs might be the easiest to recognize, but are you sure you know what they represent?
The Twitter tab totals the number of tweets in the past 7 days that contain either the title of the release, or the link to the full story. Full press releases can’t be posted to Twitter due to character limits, but press releases can gain significant traction if they are shared on social media.
Learn more about our Social NewsBuzz service here to optimize your story for Twitter.
The Facebook metric serves a very similar purpose as its Twitter counterpart, as it tracks the number of times the title was mentioned in posts, as well as the release’s number of shares on the platform.
Understand Your Success
Okay, so we’ve defined what each of these terms mean, but how do they factor into the graphs and charts that are used as visual representations of campaign success?
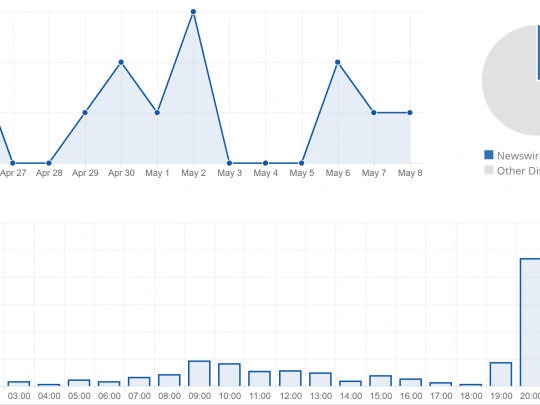
The respective graph and chart featured above represents the views recorded by Newswire’s tracking pixel. It tracks total views recorded on the Newswire website, in media outlet campaigns, and via our distribution network.
The graph shows the daily amount of views that the release receives, starting from the day of publication. The chart, on the other hand, represents the cumulative hourly traffic that the release receives. In other words, the chart above shows that on a daily basis, the release being tracked brings in the most views between 8-9 p.m.
The pie chart to the right of the screen proportionately represents the amount of views gained via the Newswire network in comparison to those gained via other distribution.
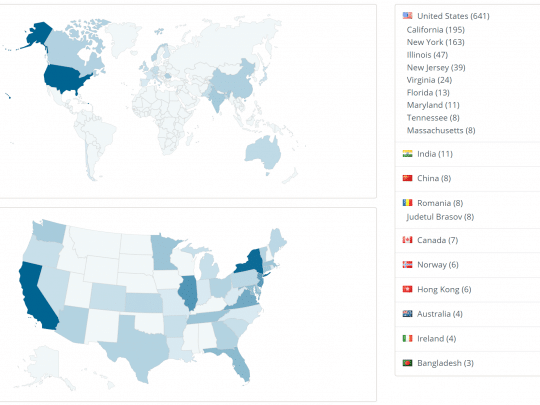
Here, the international and domestic reach are displayed. On the right, users can see how many views were recorded in a given state or country.
Although PR reporting tools can appear confusing on the surface, we hope that this breakdown shows that the majority of metrics are easy to understand and important in evaluating the overall success and reach of a campaign.