Neutral Fact Finder Claims to Fully Explain Global Warming and Accuses NASA of Distorting and Withholding Climate Data
SAN JOSE, Calif., January 16, 2018 (Newswire.com) - The following is the opinion of Kelleher & Associates Environmental Mgmt LLC.
Dear President Trump and other interested parties:
The global-warming and rapid sea-ice melting and glacial retreat that has occurred since the late 1980s, is the predictable result of an unusually long period of unusually high levels of solar activity since the mid-1930s over solar cycles 17 through 24. Climate scientists that have been asserting that this is impossible are mistaken. The fact that CO2 has a documented specific heat at STP disproves the greenhouse gas theory as far as I am concerned.
Brian Kelleher, Principal Environmental Engineer
My prior news release on December 6, 2017, titled “Neutral Fact Finder Pinpoints the Primary Source of Arctic and Global Warming” includes an introduction section that is not repeated here. This is a follow-up to that release and it serves to explain exactly what has been causing climate change making good use of NASA’s Ozone-Watch Website maps and other NASA imagery. When I refer to NASA above and below, I am including NOAA.
Findings
1. By modeling a so-called greenhouse-gas (GG) effect as “back-radiation” from increasing atmospheric CO2 levels, NASA is endorsing a theory that is fatally flawed, unsupported by scientific data and in wanton violation of the first and second laws of thermodynamics (conservation of energy and the tendency toward disorder/entropy) – According to the GG theory as it is currently explained, CO2 absorbs a very small amount of far-infrared radiation within the 14 to 16 micron bandwidths near the top of the lower atmosphere (troposphere) where the air is dry and thin. The alleged unique properties of the CO2 molecule makes it very difficult for it to absorb the 14 to 16 micron bandwidth and thereby allows it to emit broadband blackbody radiation in all directions with half going up into the layer of atmosphere above (stratosphere) and half returning to earth. The fatal flaw in the theory is that scientific data shows that CO2 strongly absorbs at the very weak 14-16 micron far-infrared bandwidth and it only has trouble absorbing relatively high-energy near-infrared radiation at 1 to 4.3 microns. “Much attention has been given to the CO2 absorption band at 15 microns because this absorption peak has high absorptivity placed in the far-IR region.” Weibe-Fuentes citing Forichev et al, 1993. Thus, there is no reason to believe that there is any 14 to 16 micron far-infrared radiation in the upper troposphere and NASA has provided no evidence to dispute this. NASA has published data that the temperature of the stratosphere has steadily declined during the period of accelerated Arctic warming as a result of ozone depletion. There are no exceptions to the first and second laws of thermodynamics.
2. In haphazardly blaming CO2 increases for global warming, NASA has been subverting evidence that clearly shows that so-called amplified Arctic warming at ground-levels is due to increases in the amount of shortwave radiation (SWR) entering the troposphere and warming the boundary layer at the air/land/water/ice/snow interface – Heat transfer equations that apply to dense humid air, reveal that the blackbody infrared radiation emitting from the earth’s surface will enter a dynamic thermal equilibrium with the warm moist air lying direction above and extending into the surface. All heat transfer from absorption of IR radiation is assumed to occur in the boundary layer and is attributed entirely to water droplets and water vapor present in the humid air. Engineering handbooks show that at 36 degree F, CO2 at the ground surface absorbs far IR radiation in the 14-16 micron bandwidth at a specific heat of 0.2 BTU/pound. Accordingly, engineers ignore the warming effect of CO2 absorption in the lower atmosphere because the specific heat of water vapor in the boundary layer at the same temperature is more than twice as high at 0.44 BTU/pound and the nominal concentrations of water vapor in humid air (3%) is three orders of magnitude higher than CO2 (0.00038%).
Explaining why accelerated melting sea ice and snowpack can only be caused by increased levels of SWR, Engineering handbooks show that SWR in the middle of the relevant ultraviolet (UV) bandwidth (300 microns) carries a huge heat energy of 12,400 volts spread over a wave 0.3 microns long (41,333 volts/micron). Far-infrared radiation carries a paltry 0.0124 volts of energy spread over a wave 15 microns long (0.00083 volts/micron). This also explains why NASA is endorsing a GH gas theory that manufactures very high levels of blackbody infrared energy out of thin air.
3. In haphazardly blaming CO2 increases for global warming, NASA has been subverting evidence of substantial increases in the amount of UV radiation entering the Arctic troposphere during the sunspot-active first six years of 11-year solar cycles – In December 2010, NASA announced that after making improvements to its space-weather satellite instrumentation, it had discovered that the amount of high-energy UV radiation entering the upper atmosphere in 2004-05 was an astonishing 4 to 6 times higher than what had been assumed, and that the visible bands were about half of what had been assumed. The near infrared was about as expected. According to the announcement, the UV wavelengths that were dramatically higher fell primarily in the range of 0.20 to 0.35 microns. Because ozone absorbs UV in rate-limiting fashion over the range of 0.17 to 0.35 microns, NASA’s “surprise finding” shows that the earth’s ozone layer is a much more important factor in climate change than had been previously assumed and modeled. From the “SIM spectral irradiance data” provided below, I roughly estimate that a massive 40 percent of incoming SWR within the all-important 0.1 to 0.8 micron bandwidth is UV and that about half the UV (20 percent) is UV-A and the rest (20 percent) UV-B and C. SIM Spectral Irradiation, May 14, 2003: http://lasp.colorado.edu/lisird/data/sorce_ssi_l3/ .
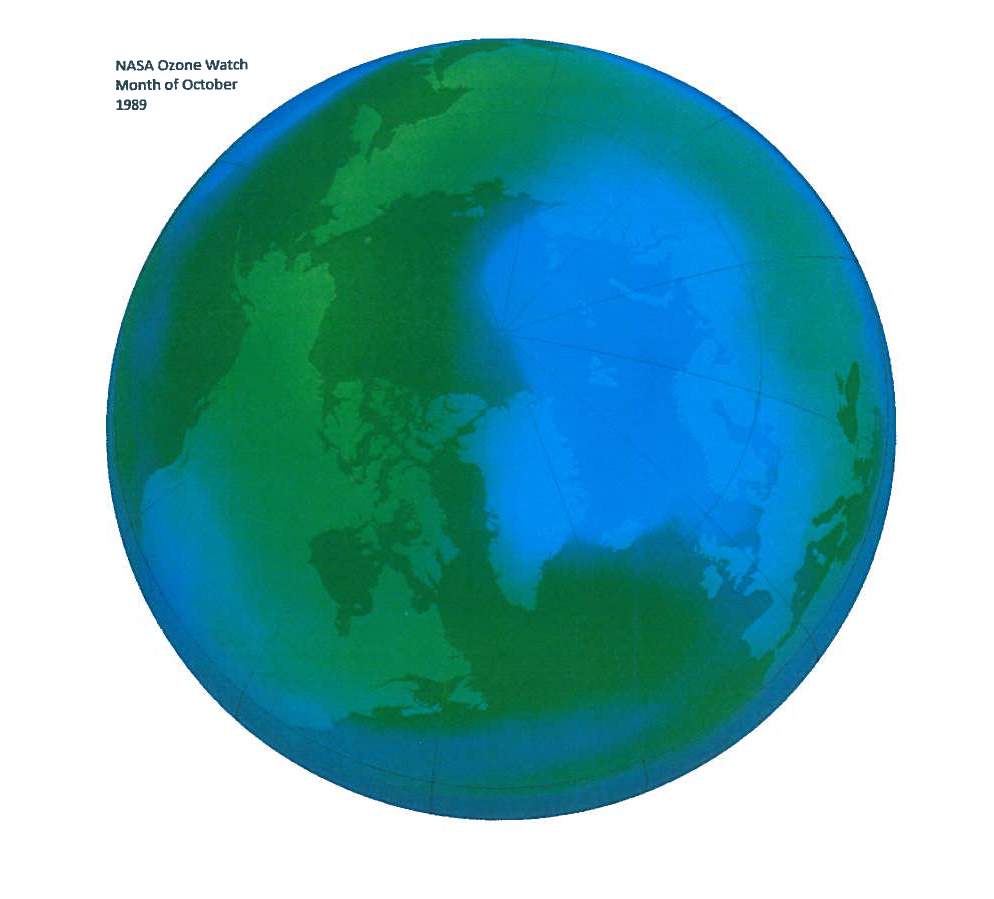
4. In haphazardly blaming CO2 increases for global warming, NASA has been subverting evidence of the direct and indirect solar-forced ozone depletion that has occurred in the polar areas and mid-lower latitudes during the last four solar cycles due to the very high incidence of medium-sized and large to gigantic solar flare, sometimes accompanied by coronal mass ejections (CMEs) – While the evidence of such depletion is documented in the NASA Ozone-Watch websites and various research reports, NASA continues to tell the world that ozone depletion is primarily the result of pollution (Freon emissions).
Using the NASA ozone-watch maps, I am estimating that the column ozone within the southeastern half of the Arctic circle decreased from about 320 DU to 280 DU between October 1984 to October 1994 (say 10 percent) and from October 1994 to October 2004 to about 250 DU (say 20 percent). These seasonal decreases cannot be attributed to Freon pollution and are therefore ignored by climate scientists. Thus, if these ozone decreases resulted in corresponding increases that are applied to just 30 percent of the total SWR entering the troposphere, the total solar irradiance increases would be about 0.3 percent per year from 1980 through 2004, all of it in the very high energy UV bands. Please take note that the depletion is occurring during the Arctic’s period of documented accelerated seasonal warming and is most pronounced in those geographic areas that have been experiencing the most warming.
With the following link to the NASA ozone-watch map for December 10, 2017, I am pointing to a tell-tale area of seasonally severe ozone depletion that peaks in September through December that further identifies the source of global warming. It is located along a swath of lower latitudes comprising the rim of the area involved in the so-called North Atlantic Oscillation. It curls southwest out of the North Atlantic and extends westerly through northern Florida and across southern Louisiana and southern Texas between roughly 25 to 30 degrees north. It then curls up to the northwest between 30 to 35 degrees north through southern Arizona and southern California and out into the eastern Pacific Ocean. The swath of ozone-rich stratospheric air that was displaced from these lower latitudes can be seen rotating northeasterly into the Arctic where it is just beginning to replenish the heavily depleted ozone layer. There is similar seasonal depletion at the corresponding latitudes in the southern hemisphere that peaks in February through May. Ozone Dec 10, 2017, NH: https://ozonewatch.gsfc.nasa.gov/Scripts/big_image.php?date=2017-12-10&hem=N
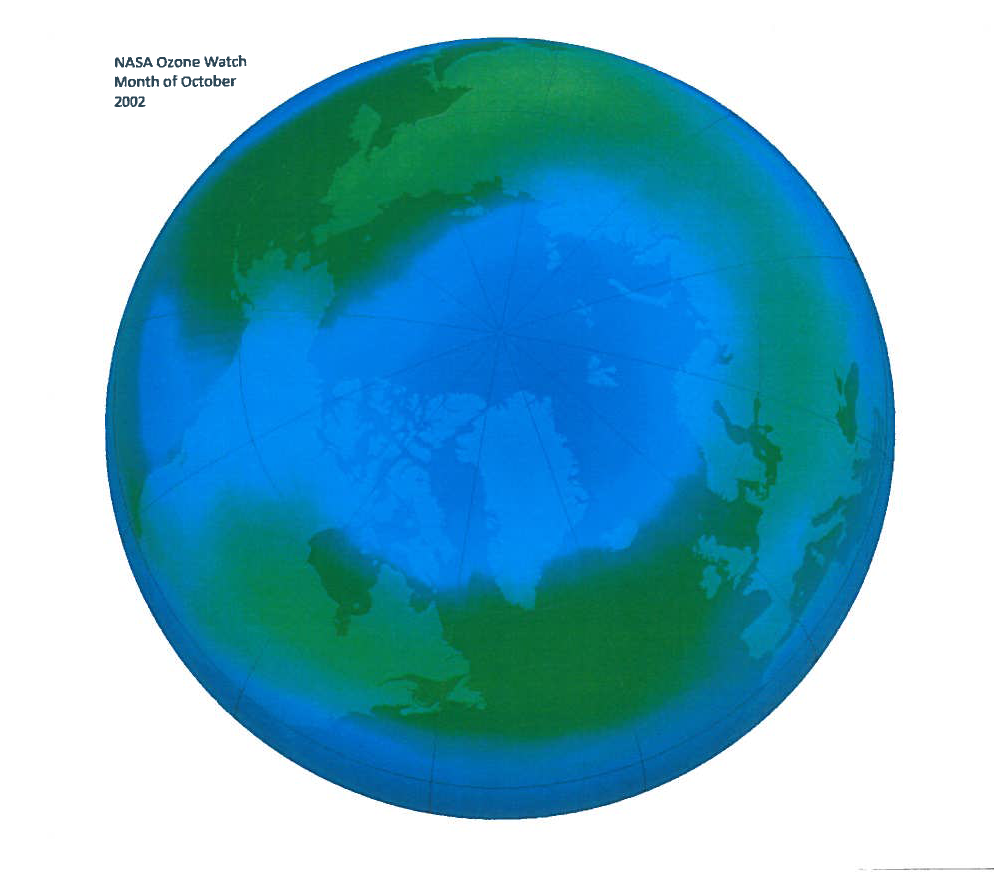
The documented rapid acceleration of sea ice loss commencing in 2002, correlates with a very high frequency of an extremely powerful class of CMEs called Ground Level Events. See the attached NASA ozone-watch map for October 2002.
5. In haphazardly blaming CO2 increases for global warming, NASA has been subverting evidence that shows that increased levels of incoming SWR have been warming the Arctic’s middle and lower troposphere during the period of amplified Arctic warming – The Arctic late summer and fall is a period of rapidly declining solar zenith and increasing cloud cover. Under these conditions, it is reasonable to assume that the vast majority of the extra UV that is entering the troposphere during periods of solar maxima or seasonal ozone depletion is absorbed by aerosols in the dense cloud layers, especially those hovering over melting sea ice, explaining why it is not being detected at high levels at ground surface. I am flagging this as the primary source of the well-documented seasonal downwelling of longwave thermal energy that has been observed since 1989 in the Arctic biosphere during that exact same period and extending into the Arctic winter. Also readily explaining the near-surface warming/sea-ice loss, the water-vapor content in the lower troposphere increases as the downwelling IR radiation approaches the ground surface with its maxim level of infrared absorption just above and extending into the surface.
Recommendation – Because NASA has concluded that CO2 is an air pollutant for questionable reasons, I strongly recommend that the Trump administration have the EPA review this news release as well as the question of the source of global warming. I recommend that this be done with the assistance of a panel of unbiased private-sector environmental engineers and physicists rather than climate scientists.
I warrant that I have conducted my investigations impartially and believe my conclusions are sufficiently supported by valid scientific evidence to stand up in a court of law.
Disclaimer – This press release contains the personal opinions of an American citizen based on his understanding of technical data and his experience as a neutral court consultant. Despite my professional standing, I am not claiming to be a professional engineer nor a consulting engineer given where I reside. California, unlike the rest of the country, does not grant licenses to environmental engineers given a long-standing preference by its licensing board to rely primarily on state-registered geologists to protect the state's lands, indoor air and waters.
Sincerely,
Brian T Kelleher
Principal, Kelleher & Associates Environmental Mgmt, LLC
San Jose, CA 95121
bkellehr@ix.netcom.com
408-677-3307
Source: Kelleher & Associates Environmental Mgmt LLC
Related Media