
Build Patient Attraction and Retention Growth Strategies
Overview
Identify and prioritize opportunities to address network leakage by tracking patient utilization of the care continuum after an interaction with a potential referring provider. This methodology measures success of a health system’s strategic planning initiatives and market-specific growth over time.
Measuring Patient Flow
HSG measures Patient Flow through a separate and distinct 3-step process that begins with the identification of source providers and the associated patient population. Patient populations are customizable to answer the specific business question presented.
STEP 1: IDENTIFY SOURCE PROVIDER PATIENT POPULATION
PATIENT POPULATION
Define source provider(s) and associated patient populations for evaluation.
STEP 2: DEFINE PATIENT FLOW WINDOWS
Track all patient interactions PRE and POST source provider services for custom care windows (30, 60, 90 Days).
STEP 3: MEASURE PATIENT FLOW
Measure percent of service volume to aligned providers versus competitor providers and/or facilities.
Customizable to Your Health System’s Needs in HSG Dashboard
Workbook Features
Bring your data to life through different reporting lenses in HSG Dashboard. 90-Day Patient Flow will be measured from CLIENT employed, competitor employed, or local independent primary care providers in CLIENT’s service area to all specialty providers (associated with CLIENT or not) as sampled during our scoping call.
- 90-Day Patient Flow to Specialty Providers, including but not limited to:
- Primary Care to Specialist Overall (Medical and Surgical Specialties)
- Primary Care to Specialist by Primary Care Practice
- Primary Care to Specialist by Individual Primary Care Provider to Top 10 Specialty Care Providers
CUSTOMIZABLE TO YOUR HEALTH SYSTEM’S NEEDS
HSG Dashboard Workbooks
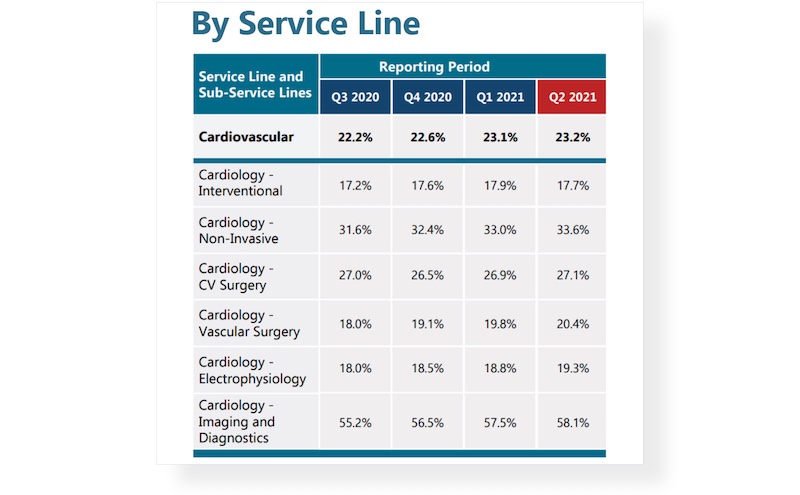
HSG Outpatient and Ambulatory Market Share
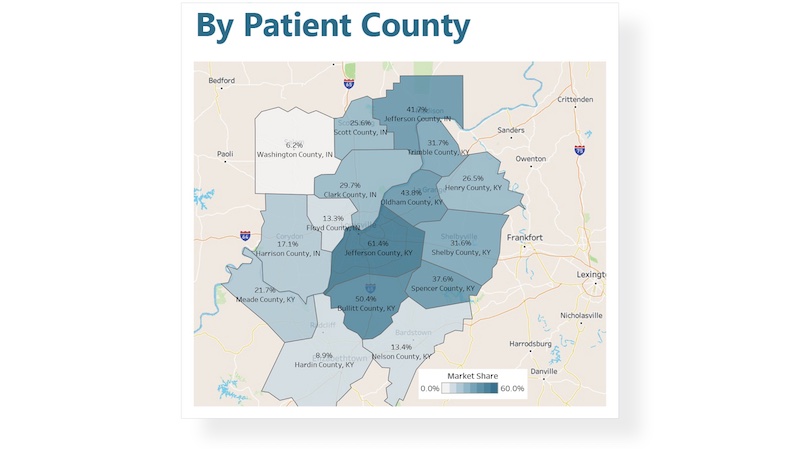
Evaluate health system overall market share, service line and subservice line market share, and geographic market share for professional and technical components of all relevant service lines across the Outpatient, Ambulatory and Physician Office environments.
HSG State-Level Market Share
Better understand Inpatient Utilization trends at the market, service line, and subservice line levels and visualize these data sets consistently with HSG Outpatient Market Share.
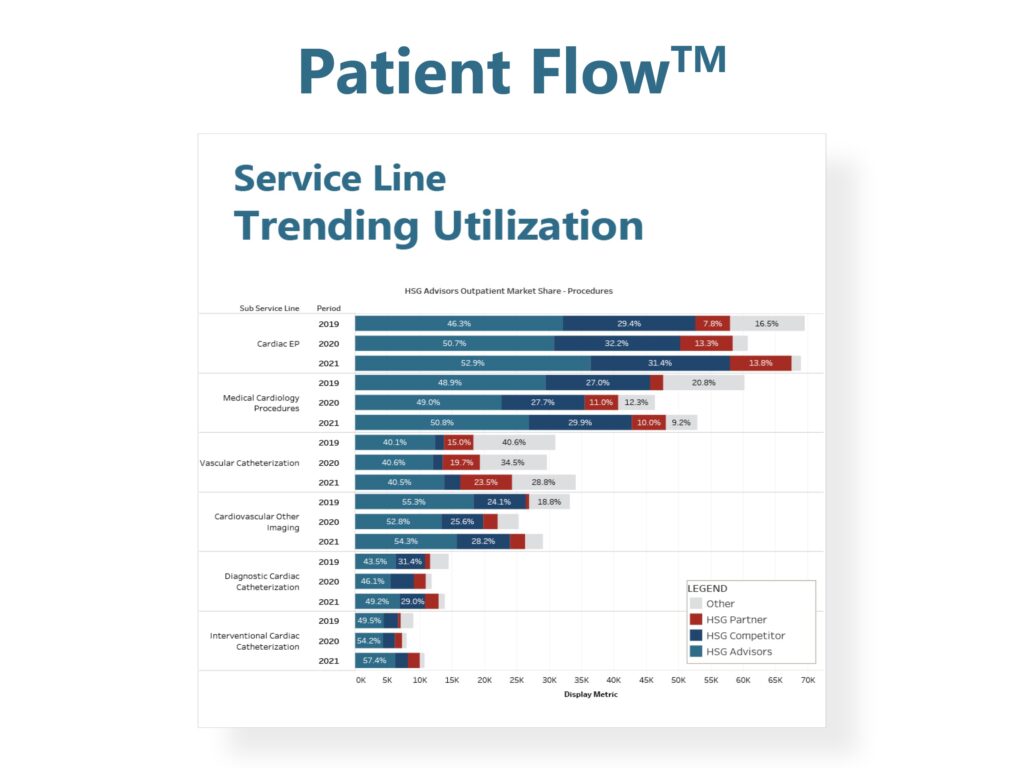
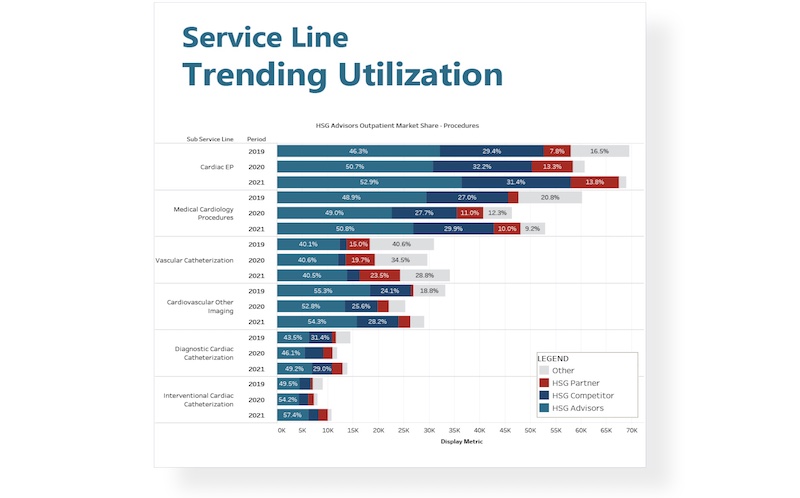
HSG Patient Flow™

Track patient utilization of the care continuum after an interaction with a potential referring provider, allowing health systems to determine network leakage and prioritize opportunities to addressing leakage.
HSG Patient Share of Care
Track overall patient utilization of the care continuum within a given market, focused on determining the total share of patient healthcare spend that a health system is capturing within a discrete patient population.
HSG Provider Dashboard

Track delivery of patient care by individual providers, practices and physician groups by specialty, allowing health systems to have insight into how individual groups and providers (employed, aligned, competitive) are performing in the Outpatient and Ambulatory market.
Related Resources
-
Healthcare Intelligence Dashboard Drives Strategic Growth I HSG Dashboard
Healthcare intelligence dashboard gives clients a way to access, visualize, and analyze complex internal and external data sets
-
Leveraging Outpatient Utilization Data to Develop Ambulatory Growth Strategies
Article takes a deeper look at market-specific dynamics and how to develop relevant growth strategies around them.
-
HSG Claims Data Analytics Updates: February 2023
Updates to the platform on Outpatient and Ambulatory Market Share, Patient Flow, and Patient Share of Care.