While the Fed this week once again did not raise interest rates, the significant surge in precious metals seen on Wednesday.
While the Fed this week once again did not raise interest rates, the significant surge in precious metals seen on Wednesday was based on the change in the wording used in the accompanying policy statement. Whereas over the past few meetings the Fed has given little indication that it was considering a second interest rate hike, this time the central bank used the following distinct language: “The case for an increase in the federal funds rate has strengthened.”
As investors, we must remember that we are still living in an unprecedented age for low interest rates. At the 0.25% – 0.50% target rate, this is still the lowest that interest rates have been in the history of the Federal Reserve, including the following two critical time periods:
- The Great Depression: rates hit a low of 1.5%
- World War II: rates hit a low of 1.0%
Can we imagine that what is happening in the world economy currently must be deemed by the Federal Reserve to be more severe than both the Great Depression and the largest international conflict in the history of planet Earth?
Not only are rates lower than in each of these periods, but they have been held lower for a greater number of years than at each of these previous troughs, now eight years and counting below the 1.0% mark. Of course, holding interest rates so low requires a continuous electronic “printing” of new money, which is used to buy the entire short-end of the interbank bond curve. The longer that rates are held below what the market would naturally set them at — usually between 2.0% – 5.0% — the more inflation the Fed is building underneath the system.
The data to support this coming wave of inflation can be seen from the graph of the total reserve balances held at the Fed. Recall that what appears on this chart is money the Fed has created in order to buy sufficient bonds needed to force interest rates lower:
(See image A)
We can see that there is no precedent for the amount of money created since 2008. The Fed — and other major world central banks — have embarked on a money-printing spree that will go down in history as an experiment like none other. Note that there *is* a line on this graph dating back to 1950… it is just so low on the Y-axis that it barely registers when compared to the nearly $2.4 trillion created by the bank since 2008.
The strange thing about inflation is that once central banks create it — they cannot control precisely where it flows after it enters the broad economy. Similar to turning on a fire hose in an attempt to water the garden flowers, some may flow to the intended destination, but far more will eventually flow to unintended areas.
Thus far, the recipients for most of the inflation are clear, and we have discussed them in past articles: world bond and stock markets, which are both at all-time highs simultaneously (in itself an unprecedented situation).
But nothing happens in a vacuum.
Newton’s Third Law of Physics says: “For every action there is an opposite and equal reaction.” And it appears that the unintended consequence of the Fed’s actions are about to be felt elsewhere: in the US dollar.
US Dollar
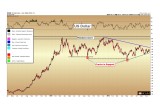
The chart below shows the US dollar as measured by the Dollar Index, a trade-weighted basket that measures the value of the US currency versus the sum of the following:
- Euro (EUR), 57.6% weight
- Japanese yen (JPY) 13.6% weight
- Pound sterling (GBP), 11.9% weight
- Canadian dollar (CAD), 9.1% weight
- Swedish krona (SEK), 4.2% weight
- Swiss franc (CHF) 3.6% weight
(See image B)
We have been following this chart now for several months, as the dollar has been consolidating for nearly two years between the 92 level and the 100 level on the index.
Over the long run, we expect gold and silver to be moving higher in all currencies, no matter what happens with one fiat currency versus another… but over the short run, gold tends to see its most significant advances when the US dollar is weak, as gold is priced primarily in US dollars for purposes of international trade.
Thus, let us remember that the advance seen in gold from the December 2015 low of $1,045 per ounce to the recent high of $1,378 has taken place within a backdrop of a relatively stable US dollar, which has only fallen from 100 to 95 on the Index.
It appears that gold is now waiting for further signals from the currency market in order to begin its next move, and as the dollar has continued to consolidate, so has gold.
Yet these consolidations will not continue forever.
Recent Technical Analysis on the Dollar
On the chart above, we can see converging sets of trendlines, shown in royal blue for primary downward trend and teal for short-term uptrend. These trends have been converging since December 2015 and May 2016, respectively. One of these trends is due to break within the next 4-8 weeks.
While consolidations such as this are inherently neutral when viewed in isolation (they can break either upward or downward), when we view the action within the context of the preceding advance the nearly two-year consolidation in the dollar is increasingly taking the form of a broad long-term top. Indeed, it would be rare to see such a lengthy pattern result in a continuation move higher.
From the short-term perspective, our “hints” that the break will be lower come from the two cracks in the support zone below 93 on the index. These cracks have been warning signs that buyers of the dollar are not as resolute in supporting the currency as many would believe. This is in contrast to the resistance zone at 100, which has shown very distinct and unhesitant selling pressure each time that level is reached.
Should the lower converging (teal color) trendline break in the dollar in the coming weeks, the currency should be making new lows below the 92 region in short order. This move is expected to coincide with the converse breaking of the long-term downtrend that has held the price of gold lower from 2011 – present (see Gold Analysis, below).
Gold Analysis
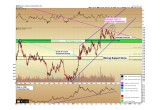
Gold made another attempt to overcome its long-term downtrend this week, reaching $1,343 on Thursday before falling back to $1,337 by the end of the week.
This was the fifth attempt by gold to break higher from the current consolidation. Each attempt represents another opportunity as buyers chip away at the overhang of sellers. Although we cannot be certain exactly when the line is going to be crossed, a breakout of this magnitude will leave no doubts when it does occur.
(See image C)
Resistance is clearly defined by the downtrend as between $1,355 – $1,378.
The rising blue trend channel since the December lows is now coming into focus for support near $1,310, and immediately below that the support zone that has held since June comes in between $1,285 – $1,305.
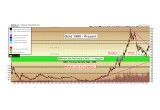
Longer-term, we must remember that the bottom seen last December was nothing less than a retest of a multi-decade breakout from the 1980 – 2009 consolidation in gold. The move seen from 2009 – 2011 was the initial surge from the breakout. However, multi-decade breakouts do not tend to see their advances finish in two years only. A more significant advance is believed to be in the early stages of developing.
(See image B)
Christopher Aaron,
Bullion Exchanges Market Analyst
Christopher Aaron has been trading in the commodity and financial markets since the early 2000’s. He began his career as an intelligence analyst for the Central Intelligence Agency, where he specialized in the creation and interpretation of pattern-of- life mapping in Afghanistan and Iraq.
Technical analysis shares many similarities with mapping: both are based on the observations of repeating and imbedded patterns in human nature.
His strategy of blending behavioral and technical analysis has helped him and his clients to identify both long-term market cycles and short-term opportunities for profit.
This article is provided as a third party analysis and does not necessarily matches views of Bullion Exchanges and should not be considered as financial advice in any way.
Share:


