Gold and silver have recovered moderately over the past two weeks, which is certainly a positive sign that buyers remain ready to step in anytime.
Gold and silver have recovered moderately over the past two weeks, yet still remain within the confines of the ongoing consolidations we have been monitoring over the last several months. For the week, gold rose 2.2% or $27 to close at $1,255 as of the final trade on the New York COMEX on Friday afternoon. Meanwhile, silver posted a gain of 3.3% or $0.52 cents, to close at $16.46. Over the short run, Silver's recovery and close on a weekly basis above the key $16 level is certainly a positive sign that buyers remain ready to step in anytime the price drops into the $15’s.
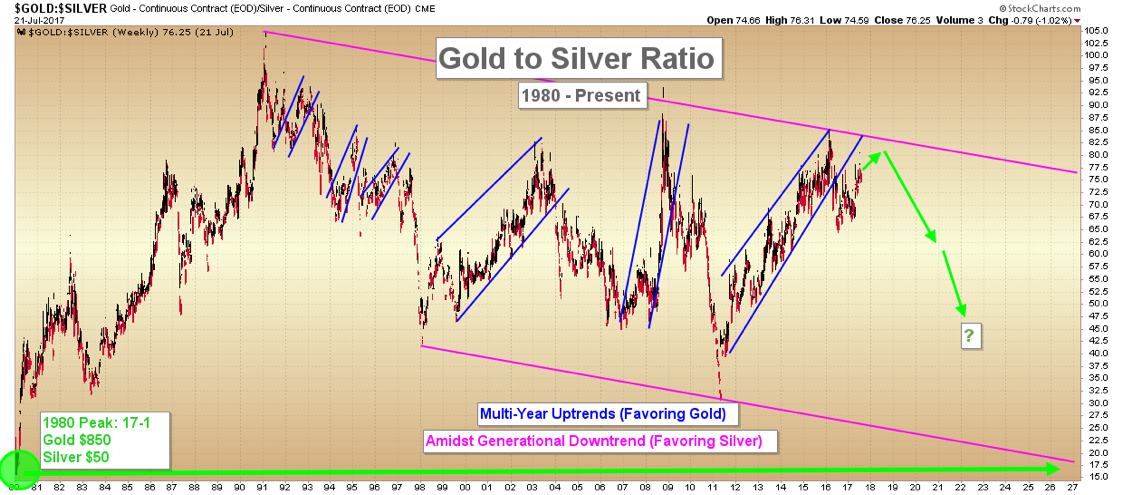
It is periodically beneficial to focus not only on gold and silver themselves in isolation but to examine the ratio between the two metals. In other words, we are referring to the number of ounces of silver required to purchase one ounce of gold.
As a backdrop, readers should know that in general throughout history, a falling gold to silver ratio has tended to correspond with rising prices in both precious metals, whereas a rising gold to silver ratio has tended to correspond with falling prices in the metals. Of course, there are exceptions to every rule, but this is the prevailing trend that we observe when examining the ratio throughout history.
Why does a falling gold to silver ratio correspond with rising gold and silver prices?
There are several reasons for this phenomenon. First, the silver market is extremely small compared to the gold market. For example, in 2016 just over 1 billion ounces of silver were produced from mining and scrap supply. Yet of this, approximately 80% or 800 million ounces were used for industrial fabrication: a combination of jewelry, silverware, electronics, solar panels, and photography. This silver was essentially “consumed” by industry or permanently taken off the market. What this means is that in 2016, only 200 million ounces were available for investment demand.
Because the industry has consumed the majority of silver for several decades, it is estimated that only 2-3 billion ounces exist above ground in readily investible form, meaning coins and bars.
Compare this to gold, in which the industrial demand is tiny in that only 16% of the 128 million ounces purchased in 2016 were used for fabrication. Of course, this means that 84% of the gold produced in 2016 is still available to the market in one form or another.
Taken as a sum, we can see that in dollar terms, the total physical silver available in investible form pales in comparison to the total quantity of gold available. Most of the silver brought to market has been consumed by industry over the last 50 years. Not so with gold.
What Happens in a Rising Gold Price Environment?
Given the much greater quantity of gold than silver that exists above ground for investment purposes, we must consider what happens in a rising precious metals price environment. Gold prices initially begin to rise due to purchases from larger players: central banks, institutions, sovereign wealth funds, and some forward-looking individuals.
With the rare exception (Warren Buffet bought 130 million ounces in 1998), silver is generally not the target of the central bank or institutional demand. Yet, importantly, silver is the target of individual investor demand.
The real power in the silver market lies in the potential for it to become the primary target for the individual investor. In a rising metals price backdrop, there will come a point when the average person does not have the resources available to purchase an ounce of gold. Where will he turn?
Throughout history, the answer is silver.
Imagine that an investor desires to move $10,000 into precious metals and that he chooses to split this investment evenly at 50% gold and 50% silver. With that split at today’s prices, he will just barely purchase 4 ounces of gold, yet over 300 ounces of silver (ignoring premiums). Again, let us remember that despite their vastly different values, there is more physical gold available above ground than silver. So here, by splitting a purchase evenly between the two metals, a single investor has taken possession of a much greater quantity of the world’s investable silver than of that for gold.
What if 10% of the Population Wanted to Buy 10 Ounces of Silver?
Now consider a scenario for the future, that as gold exceeds $1,500 in the years ahead, the average investor is largely priced out of the gold market. Again, where will he turn?
If 10% of the United States’ 320 million citizens each wanted to purchase 10 ounces of silver, the entire available investment supply for the year would be wiped out. What if 10% of the world’s 7.5 billion people each wanted to own 10 ounces?
Returning to the Gold to Silver Ratio
The potential for the precious metals, and especially silver, is significant over the years to come. While the ongoing corrections could continue for some time further, investors should carefully consider the underlying supply and demand fundamentals for the precious metals which will eventually exert themselves. In a rising gold price environment, silver will often lag initially, but when it does begin to gain interest from the average investor, even a modest inflow of capital into the “lesser” metal will have an oversized effect on its price.
We close with a long-term look at the gold to silver ratio. Currently, at 76 ounces of silver to purchase one ounce of gold, at the last precious metals peak in 1980, this ratio hit 17. As we can see, there have been several multi-year uptrends in favor of gold, amidst what appears to be a generational decline in the ratio (in favor of silver). Our expectation is that by the time the current cycle ends, the ratio will once again reach levels last seen in 1980.
Image A
Christopher Aaron,
Bullion Exchanges Market Analyst
Christopher Aaron has been trading in the commodity and financial markets since the early 2000's. He began his career as an intelligence analyst for the Central Intelligence Agency, where he specialized in the creation and interpretation of pattern-of-life mapping in Afghanistan and Iraq.
Technical analysis shares many similarities with mapping: both are based on the observations of repeating and imbedded patterns in human nature.
His strategy of blending behavioral and technical analysis has helped him and his clients to identify both long-term market cycles and short-term opportunities for profit.
This article is provided as a third party analysis and does not necessarily matches views of Bullion Exchanges and should not be considered as financial advice in any way.
Share: