Two scenarios would change the validity of the basing action we are observing in the long-term cup formation of gold price. Gold was resilient over the last two weeks in holding up over the $1,200 level. But for the week, gold closed down $16 or 1.4% to finish at $1,188 as of the final trade on the New York COMEX on Friday.
Gold was resilient over the last two weeks in holding up over the $1,200 level, and indeed almost had us fooled that it was about to ignore this resistance and continue to advance higher. Yet after several failures to mount a sustained advance, gold succumbed to selling pressure by Tuesday. For the week, gold closed down $16 or 1.4% to finish at $1,188 as of the final trade on the New York COMEX on Friday.
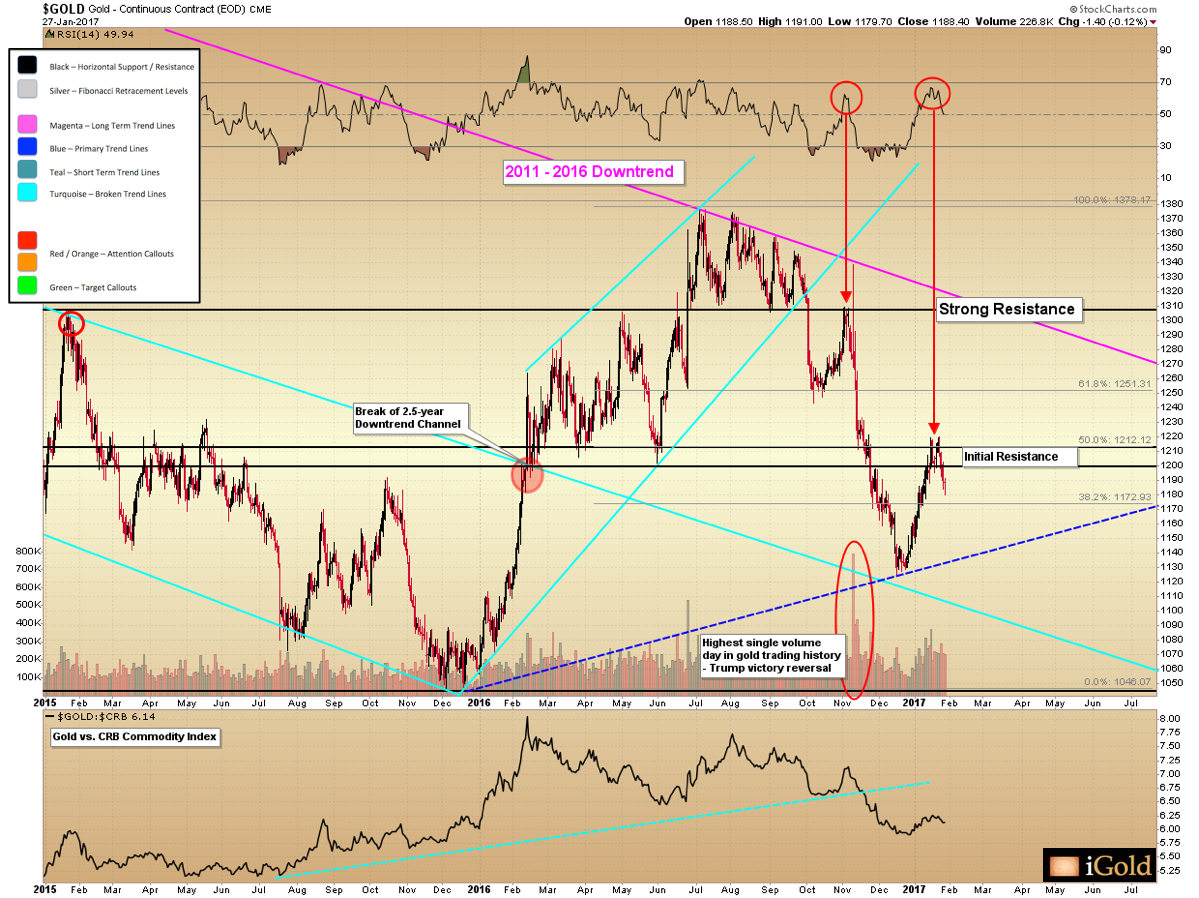
Although gold spot price did push above the $1,200 figure marginally, the message of the market here is of sellers who showed up every time gold attempted to make some distance above the round number. We can thus update our primary gold chart below, with Initial Resistance labeled as $1,200 - $1,215.
Image A
Our short-term expectations for gold continue to call for lower prices. At the same time, we can tentatively draw a new trendline between the December 2015 low and the higher December 2016 low, as shown above in blue (dashed).
It would be extremely healthy action to see the new trendline tested and held for a second time at a nominally higher level, such as $1,130 - $1,135. This is where gold would meet the trend if it were to test it this week.
Gold’s Long-Term Basing Perspective
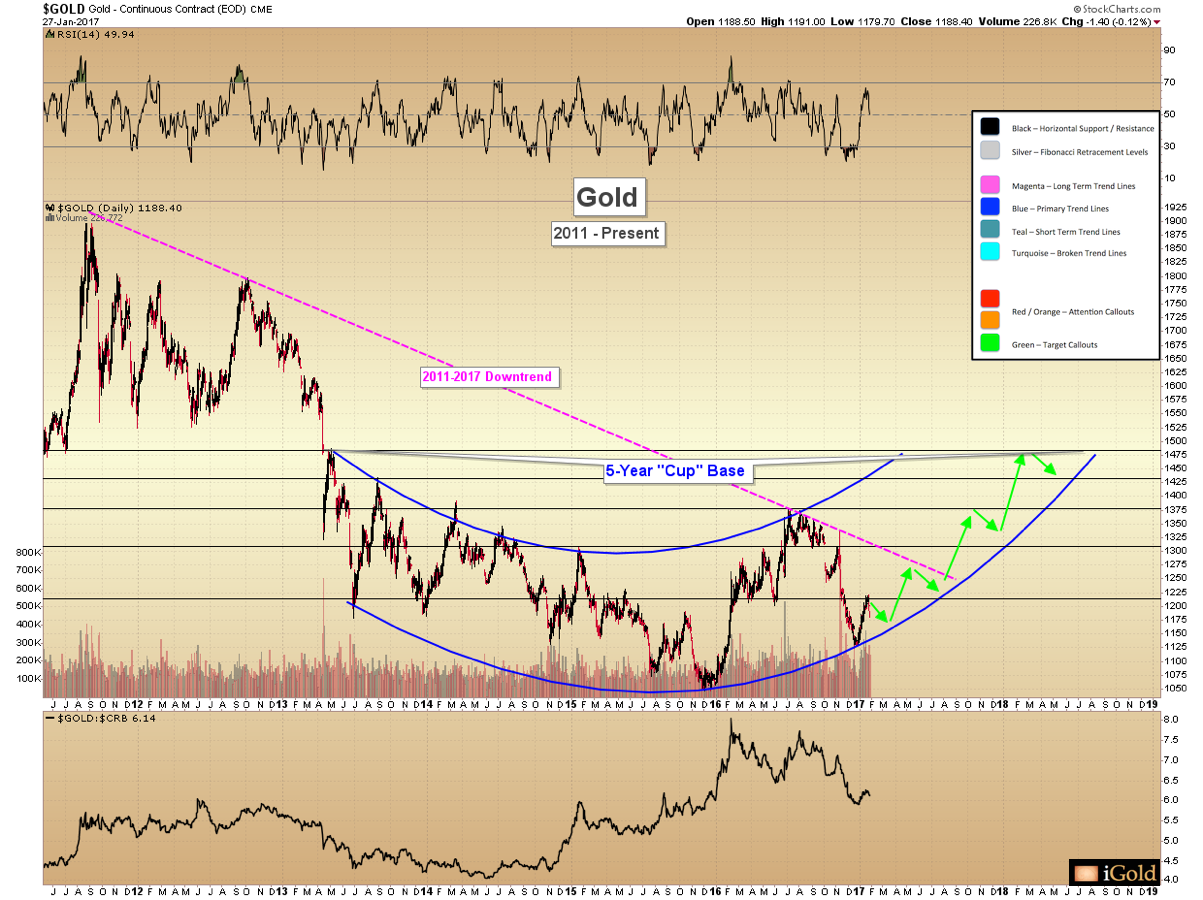
Backing out the timeframe, periodically it is beneficial to strip away previous annotations and start with a blank chart, to gauge the big-picture trend of the market. Below is gold from 2011 to present, with minimal annotations near the current price – instead with a focus toward the major pattern developing over the last five years:
Image B
Despite the weakness seen since July, what is emerging here in gold is a five-year “cup” base pattern. This basing pattern features multiple swings of $300 higher and lower in both directions – but as a sum, we are observing a clear rounded bottoming pattern, with a reduced rate of decline from 2013 – 2015 now giving way to the beginning of an advancing market.
Strong evidence for the shift in trend can be seen from the fact that the 2016 high of $1,378 clearly exceeded both the 2015 high of $1,305 and the mid-2014 high of $1,345. A bear market is defined by lower peaks – and when a new peak, such as that seen in 2016, exceeds a prior one – it is telling us that the market is in the process of changing behavior.
Anticipating Short-Term Potentials
Of course, these changes take time to play out and are filled with wild short-term gyrations. The question that we still cannot definitively answer is: was the recent December 2016 $1,124 low the bottom for the entirety of the correction off 2016’s peak?
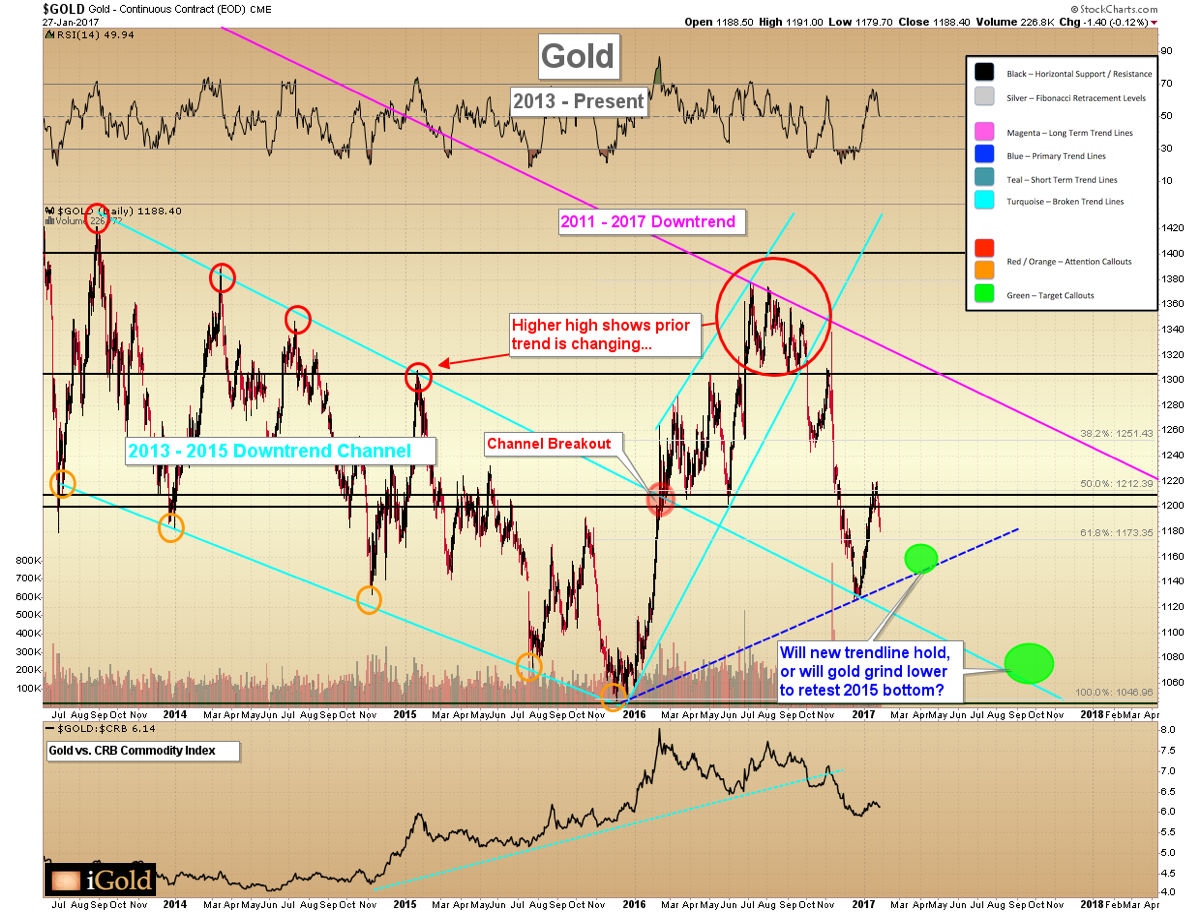
The above base scenario assumes that it was – and if so, after a somewhat higher low due to form within the next few weeks, gold should continue a two-steps forward, one step backward advance through the remainder of the year to re-challenge the 2016 high at $1,378.
However, let us imagine that the recent low does not hold, and that gold continues to grind down further for several months – retesting the 2015 bottom in the vicinity of $1,045. The two hypothetical are presented below through the green target callouts:
Image C
Neither of the above two scenarios would change the validity of the basing action we are observing in the long-term cup formation above. If a double bottom or a grind below $1,100 in gold must occur, it will only expand out the timeline of the basing formation, not change the overall pattern.
The importance of the higher high in 2016 amidst a lessening rate of decline over the three years prior should not be underestimated (large red circle, above). This market is in the process of changing its trend after the 2011 – 2015 decline… it is only the precise gyrations that remain to be seen and navigated.
Christopher Aaron,
Bullion Exchanges Market Analyst
Christopher Aaron has been trading in the commodity and financial markets since the early 2000's. He began his career as an intelligence analyst for the Central Intelligence Agency, where he specialized in the creation and interpretation of the pattern of life mapping in Afghanistan and Iraq.
Technical analysis shares many similarities with mapping: both are based on the observations of repeating and imbedded patterns in human nature.
His strategy of blending behavioral and technical analysis has helped him and his clients to identify both long-term market cycles and short-term opportunities for profit.
Share: