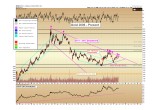
The precious metal is now close enough to its key long-term 2011-2017 downtrend, and it could be another attempt to overcome the critical level.
Gold closed higher by $14 or 1.2% to finish at $1,268 for the week. The precious metal is now close enough to its key long-term 2011-2017 downtrend that we can again call this advance another attempt to overcome the critical level. The last attempt to do so came on April 17 at $1,290 per ounce – a level which was exceeded for a few hours before failing to hold it throughout the overnight trading hours. As the trendline is downward sloping, the level to overcome inherently is falling every week, and we thus shift our focus to the $1,280 level, as shown below by the most recent arrow just above that long-term (magenta color) trendline.
Image A
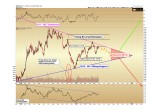
We have stated in the past that our target upon a successful breakout of the pennant-shaped consolidation will be $330 above or below the apex of the consolidation, which is $1,205: thus, either $1,535 or $875, within 6-12 months of the breaking point.
We will have much more analysis on what short-term swings to expect within this significant movement once the break of the pattern finally happens. For now, let us continue to focus on the pattern’s resolution itself, and the $1,280 figure that would be required at this juncture.
Image B
The most probable scenario we see is that gold price again fails to break out this week, and continues to grind in the low-mid $1,200’s through Q3, in what should be the final exhaustive consolidation to wear out the last remnants of the “hot money” that became interested in the sector only after 2016’s first-half surge.
Of course, at our firm we are already largely invested, and that is because in a bull market surprises should be expected to the upside, i.e. a breakout sooner – perhaps by mid-summer – rather than later in the year.
While in the midst of a lengthy consolidation it is difficult to imagine that anything else will ever occur. Frustration grows as the sector oscillates without much definitive movement. This is exactly the time to go against the herd and not succumb to such limited perspective.
The price action that occurs after a consolidation breaks will have little resemblance to the price action within the consolidation itself. This is one of the clearest consolidation patterns we have ever observed in the gold market. Let us remain alert.
Silver
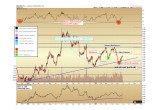
The technical action in silver is encouraging for the entire sector. Gold’s cousin rose $0.53 cents or 3.1%, to close at $17.32 as of the final trade on the New York COMEX on Friday. Having regained the rising trendline successfully, we can now call the final portion of silver’s plunge into early May below $16.50 a “false breakdown” as can be seen on the chart.
Image C
There is minor resistance at $17.75 which may halt the current advance – although if and when gold breaks its primary consolidation, silver should rise with strength such that it may simply ignore most of the previous short-term resistance levels that are visible on the chart above. On a successful gold breakout, momentum indicators and/or leading signals from the silver mining complex will be more important for gauging the next target of an intermediate high.
To the downside, we would see a break of support at $15.75 as a major red flag that the expected bull market advance may be delayed beyond 2018.
Longer-term, however, the clarity of silver’s basing pattern could not be more apparent. Silver prices are now beginning their fifth year below the $25/oz region. Downward momentum is largely exhausted after the 73% drop from 2011 – 2015. The longer that prices remain in this basing pattern, the stronger that the move higher will eventually be once $25 is breached. We must remember that at each swing higher and lower within a basing pattern, metal is being transferred from weak hands to strong.
Our general expectation is that silver may continue with this basing process with an upward bias through mid-2018.
Christopher Aaron,
Bullion Exchanges Market Analyst
Christopher Aaron has been trading in the commodity and financial markets since the early 2000's. He began his career as an intelligence analyst for the Central Intelligence Agency, where he specialized in the creation and interpretation of the pattern of life mapping in Afghanistan and Iraq.
Technical analysis shares many similarities with mapping: both are based on the observations of repeating and imbedded patterns in human nature.
His strategy of blending behavioral and technical analysis has helped him and his clients to identify both long-term market cycles and short-term opportunities for profit.
Share:


