The next 2-3 trading weeks will set the trajectory for gold price for the remainder of 2017. Early indicators suggest the eventual outcome will be higher.
Gold is inching ever closer to a resolution of the primary converging pattern that we have been monitoring for the last six months. The resolution of this pattern is going to define the trajectory for the precious metals market into 2018, so it continues to deserve our foremost attention. We have supporting indicators from other markets, but we should always evaluate gold as a distinct entity. The price action over the last week has been encouraging, although not yet decisive. For the week, gold finished higher by 2.5% or $31, to close at $1,288 as of the final trade on the New York COMEX late Friday afternoon.
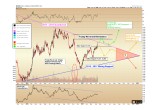
There are two significant technical concerns at this juncture. Please reference the updated 18-month gold chart below:
Image A
- Gold is once again immediately challenging the 2011 – 2017 long-term downtrend (magenta color), which has held prices lower throughout the entire multi-year decline. The exact figure we want to see exceeded and held on a weekly close is $1,290 per ounce to confirm this breakout.
- The region between $1,310 and $1,337 represents “Trump Reversal Resistance.” This is the price zone that was tested on the evening of Trump’s presidential victory on November 9, before the $65 intraday reversal occurred in the early morning hours. This reversal lower occurred on the highest single daily volume in gold trading history, as can be seen from the red callout on the volume indicator above.
High Volume Reversals
High volume reversals are near-universally never exceeded on the first attempt to overcome them. The reason for this is the sheer number of gold buyers who purchased futures contracts that day and are now underwater, and who then desire to sell at break-even when the price matches their entry level. Again, gold’s November 9 reversal saw the highest ever daily volume in gold trading history, and so barring an outbreak of major international war, we place the odds of gold exceeding the $1,310 - $1,337 Trump Reversal Resistance at near-zero on its first attempt.
Yes, international tensions are on the rise, as can be seen over the last two weeks with the United States retaliation against Syria; the US dropping the largest non-nuclear bomb ever detonated against ISIS in Afghanistan; continued saber-rattling between North Korea, China, and the US; and uncertainty regarding Russian support for Syria. Yet unless world superpowers are literally on the edge of World War III – an event we see as a low probability – the two technical resistance levels referenced above are the ones that will exert primary influence on the gold market here and now.
Early Indicator
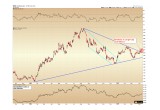
This week we noticed early warning trend indicators coming from the gold mining complex. Note in the chart below how the senior gold miners index (HUI) has broken out through its similarly-shaped converging pattern (blue lines). At this juncture, it appears that the miners are hinting that strength is to be expected in gold bullion itself.
Image B
Scenarios for Gold – Remainder of 2017
The pending breakout pattern for gold will be important because the initial target of the breakout is calculated to be equal to the 2016-2017 consolidation amplitude: roughly $330 ($1,378 - $1,045, rounded down). As gold’s consolidation reaches an apex at $1,205 (see far right, gold chart page 1), the gold target for a breakout is $1,535 within 6-12 months.
The timing for gold’s next advance therefore depends on when it indeed breaks its long-term downtrend. Two scenarios are thus illustrated on the chart (page 1) above, highlighted in green and orange/red.
Scenario A – highlighted (page 1) in green:
- Short covering and/or geopolitical tensions result in a breaking of gold’s long-term downtrend above $1,290 within the next 2-4 weeks.
- Gold’s short-term advance targets $1,320, as short sellers who were trapped between $1,200 and $1,260 cover en masse.
- Traders holding futures contracts since November 9 (Trump’s victory reversal) exit positions between $1,310 - $1,337.
- Gold stalls in the Trump Reversal Resistance zone and retreats to retest its broken 2011 – 2017 long-term downtrend during Q2 above $1,260.
- A successful retest of the broken trendline leads to the initial impulsive wave of the advance to target $1,535.
(Readers may find the nature of silver’s retest of its broken second-half 2016 downtrend, discussed in recent articles, to be a helpful analogy for what we could expect for gold’s retest of its long-term downtrend, once broken.)
Scenario B – highlighted (page 1) in orange/red:
- Gold fails to exceed its long-term downtrend within the next 2-3 weeks, and thus falls back to within the converging pennant consolidation.
- Support should be expected to emerge above the $1,180 - $1,200 support zones.
- Continued consolidative price action defines trading through mid-Q3 2017.
- A resolution of the converging pennant must occur by Q3 – Q4 2017.
- Early technical indicators (HUI senior gold miners, gold/silver ratio) suggest this resolution will be higher. Target would remain $1,535.
- Although a low probability, we must mention the downside risk. If the convergence resolves lower through a break of the 2015-2016 rising trendline (blue), gold would target $875 per ounce in 2018 ($1,205 convergence - $330 amplitude).
Takeaway on Gold Prices
The next 2-3 trading weeks will set the trajectory for the remainder of 2017. A strong advance through the declining long-term downtrend sets the stage for a first challenge of the Trump Reversal Resistance zone, which should be followed by a retest of the broken line. We then expect a strong impulsive advance to target new highs for gold in 2018.
Conversely, a rejection at the long-term downtrend means gold must continue to consolidate within its primary converging pennant for Q2 – Q3. Early indicators suggest the eventual outcome will be higher, although a low-probability resolution to the downside must be monitored until proven otherwise.
Christopher Aaron,
Bullion Exchanges Market Analyst
Christopher Aaron has been trading in the commodity and financial markets since the early 2000's. He began his career as an intelligence analyst for the Central Intelligence Agency, where he specialized in the creation and interpretation of the pattern of life mapping in Afghanistan and Iraq.
Technical analysis shares many similarities with mapping: both are based on the observations of repeating and imbedded patterns in human nature.
His strategy of blending behavioral and technical analysis has helped him and his clients to identify both long-term market cycles and short-term opportunities for profit.
Share:


