Coming into September, and especially with the drop in stocks on Friday, there is a lot of fear about what will happen over the next few weeks in the markets.
here seems to be a general sense of unease that develops during September and October, likely due to the high confluence of market crashes that have occurred during this time. The stock market crash of 1929 began in October of that year. The crash of 1987 occurred in October as well. And the financial crisis of 2008 intensified rapidly during September and October.
Perhaps there is something ingrained in our seasonal cycle as human beings that leads us to grow cautious as the days become shorter and the temperatures get colder (in the northern hemisphere)… and somehow this innate worry translates into a high correlation with stock market panics over the last 100 years.
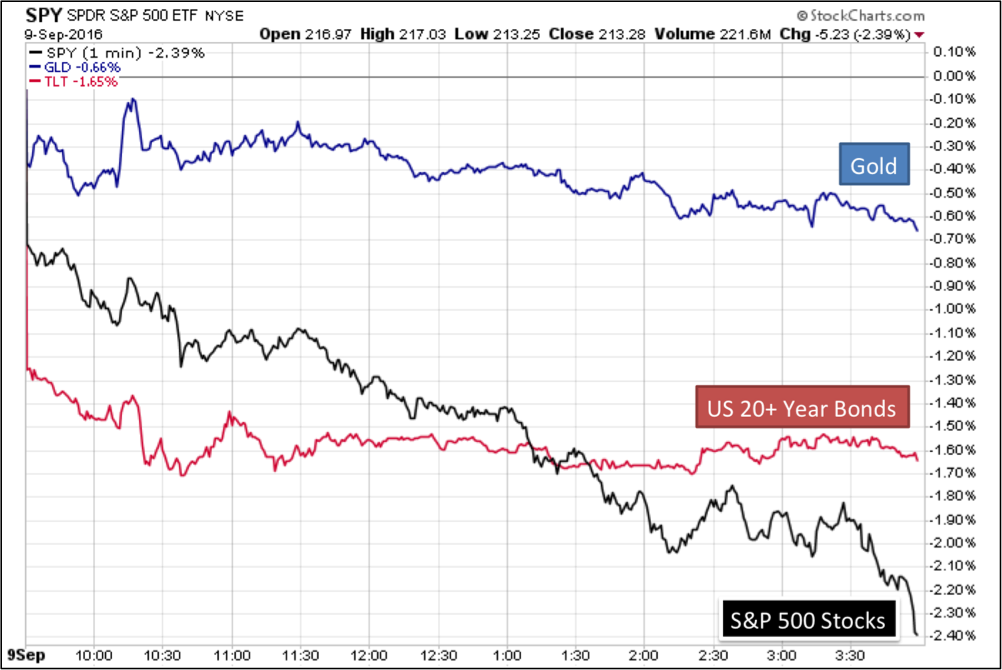
Friday saw a strong down day in US stocks, as it appears the summer lull has ended for the markets. The S&P 500 Index of US companies fell nearly 2.4% for the day, the largest percentage drop since the day of the Brexit vote in June.
(See image A)
Yet the interesting point is that US 20-year bonds — which throughout most of history would see safe-haven buying on a strong down day in stocks — fell on Friday as well. This is most unusual, and merits close monitoring over the months to come, as it is a fundamental component of our long-term thesis for ownership of precious metals. That is: if both stocks and bonds were to fall for the first time in unison over the years to come — gold would emerge as a final safety asset.
Indeed, although gold was down on Friday by 0.6%, it performed well on a relative basis when compared to bonds, which were down 1.6%.
Relative strength is an indicator we use quite frequently, as it shows certain investors stepping in to buy one asset, even as most other assets are being sold. This is especially important when comparing typical “safety” assets. While one-day of price action is not enough to call this a trend, in prior articles we have discussed why we are on alert for what will eventually be a 35+ year top in long bonds at some point before the close of the decade.
Where will the world turn for safety when US bonds, the asset known to fulfill this role for over a generation, loses its status as such?
A long-term decline in bonds coinciding with a long-term decline in stocks would be something never witnessed in modern history… but all signs indicate that it is exactly the scenario which is now brewing. Of course, bubbles are notorious for taking longer to pop than most people expect — and thus there still may be one more final “blow-off” phase in US bond prices that perhaps could see yields go fully negative (as they have in other countries). But “the writing is on the wall” for what is coming, and it is going to be a fascinating time not only to be an investor, but generally to be a citizen of this world.
Gold Update
Gold saw nothing less than its fourth attempt this week to overcome the long-term resistance that we have been monitoring for the better part of the last three months, the price level for which currently comes in near $1,360. The price spiked up to $1,356 on Monday and Tuesday, and then once again sellers showed up during the remainder of the week to drive the price back down toward $1,330. This consolidation between $1,300 and the downtrend line referenced in the magenta color has been ongoing for 11-weeks now, and it is nearing a resolution.
(See image B)
The reason we are paying so much attention to the pending break of this long-term trendline is that it is going to represent the shifting in psychology from bear to bull market for the final group of investors who are still clinging to the possibility that gold will be making a new low, below the December 2015 bottom at $1,045.
The price action that we witness after these converging sets of trend lines resolve should not resemble what has happened over the last several months. A stronger trending move should occur, which will result in a new wave of investors becoming interested in the sector.
Although it appears on the chart above that the converging consolidation could last through February 2017, in studying these types of patterns in the past we can say that they generally do not last beyond the 2/3 timeframe mark. The pattern is currently nearing the half-way mark, and we feel a break is imminent at any time now. It would take a drop in gold below the bottom level of the green support zone — $1,285 — to make us question the likelihood for the anticipated advance to come this fall.
For now, we continue to see buyers step into the gold market each time the price approaches $1,300.
Silver Update
After making another attempt to overcome the key psychological $20 figure, silver fell back starting on Wednesday and finished flat for the week, closing just above $19.
Of note is the weakness that silver saw on Friday relative to gold, falling 2.8% to gold’s 0.6% by the close of the day. This phenomenon is common on days when the stock market is seeing a strong sell-off and gold is falling even modestly. In such instances silver tends to multiply the losses in the two markets, seeing selling both from the precious metals sector and also from the industrial sector.
In a steady stock market with rising gold prices, it is often the case that silver will amplify the gains in goldas it benefits from both sectors.
This is all part of silver’s dual-personality behavior, which makes it one of the most interesting yet volatile commodities in the world. We are now seeing 5% intra-week swings in this precious metal, which will only amplify over the next few years.
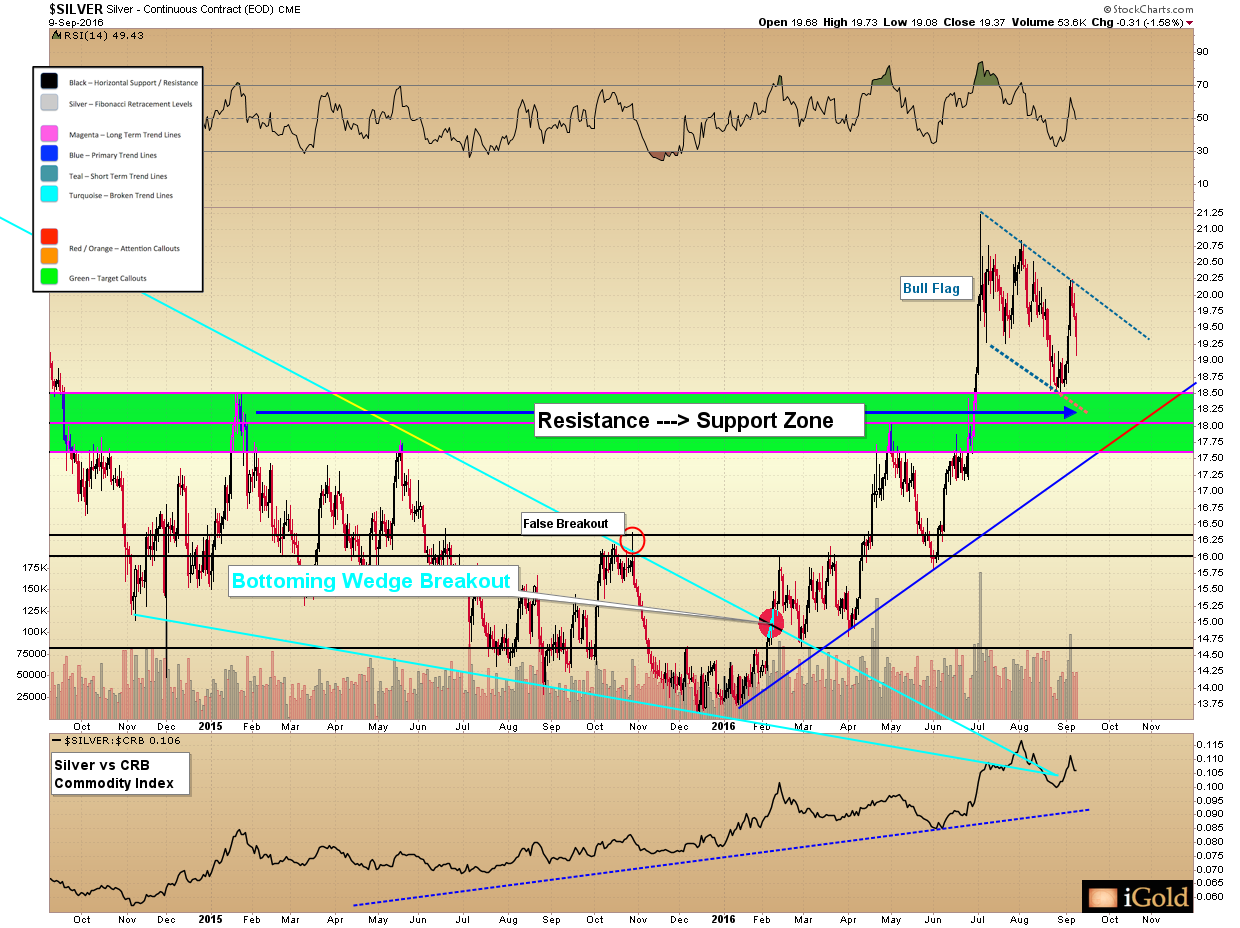
With the approach of $20 this week and then backing off again into the mid-range of the consolidation, silver’s short-term pattern is increasingly appearing to be a bull-flag correction. Seen often on individual stocks, this pattern generally represents a half-way downward-sloping pause in a primary advance.
(See image C)
In this case, the surge (or “pole” of the flag pole) was from early June at $15.80 through July at $21.25: an amplitude of $5.45.
Silver made a 2-week bottom in mid-August at $18.50, and it is quite possible that this was the low for the bull flag correction.
With an amplitude of $5.45, the pattern would target a silver price of $25.45 when added to the breakout point of the flag. Such is in line with our expectations for silver’s seasonal advance to come. We will confirm the pattern when the short-term (dashed teal-color) resistance line is broken to the upside.
Our worst-case scenario would be for silver to fall into the lower range of the green support band near $17.50 prior to its next attempt at an advance.
Christopher Aaron,
Bullion Exchanges Market Analyst
Christopher Aaron has been trading in the commodity and financial markets since the early 2000’s. He began his career as an intelligence analyst for the Central Intelligence Agency, where he specialized in the creation and interpretation of pattern-of- life mapping in Afghanistan and Iraq.
Technical analysis shares many similarities with mapping: both are based on the observations of repeating and imbedded patterns in human nature.
His strategy of blending behavioral and technical analysis has helped him and his clients to identify both long-term market cycles and short-term opportunities for profit.
This article is provided as a third party analysis and does not necessarily matches views of Bullion Exchanges and should not be considered as financial advice in any way.
Share: